| About Us | Contact Us | Member Database | Contact Database | Support Us |
Lithuanian Sustainable Energy Vision 2050
The Lithuanian Vision2050 is similar in structure to the vision for EU. It is developed together with Lithuanian INFORSE member Atgaja. The proposed development follows in general the same path as in the European vision, but given the large biomass potential, the strong growth in construction and transport, and the need to replace nuclear power without increasing gas and biomass demand, the vision has a strong focus on actions that can be implemented cost-effectively until 2020, and include more growth than the vision for EU. It includes a transition of the energy supply and demand with phase-out of fossil and nuclear energy over a 50-year period, starting with the closure of the Ignalina nuclear power plant in 2009.
The Vision was first developed in 2006 and was updated in 2008 and 2010 to the current version. Comments are still welcome.
Factor 4 for Energy Efficiency
In line with INFORSE’s global vision for sustainable energy, the
Lithuanian Vision is based on increase of energy efficiency to reach
an average level in 2050 similar to best available technologies today.
Most energy consuming equipments will be changed several times until
2050, and if new generations of equipment are made with optimal energy
performance, and markets are made to promote the most efficient technology,
it will not be a problem to reach today's best available technology,
even though the efficiency gains required are very large, - in the order
of 4 times, similar to an annual increase of efficiency of over 2% per
year from 2010. This will not happen by itself, given that the "natural" technological
development in EU has been about 1% per year. It will require concerted
actions from stakeholders involved, but if it is done on EU-scale and
the market therefore is large for each new generation of efficient equipment,
the changes will be cost-effective. The extra equipment costs will be
off-set by energy savings. To realise this, it is, however, necessary
to go beyond the conservatism of many market players in this field, and
develop a truly enabling market for energy efficiency throughout the
society.
The Challenge of Reducing Heat Consumption
For buildings the situation is different from equipment because buildings
often have lifetimes of 100 years or more. Most of the houses to be heated
in 2050 are probably already built. For Lithuania, the proposed energy
conservation plans for domestic and service sectors should be realised
and the efforts should be continued in the following decades.
Efficient Transport
For transport is assumed that the conversion-efficiency from fuel to
transport-work is increased 2.5 times (from current 15- 20% in combustion
engine systems to 50% in fuel cell systems with break-energy recoverage;
direct electrically driven vehicles have even higher efficiency), and
that the vehicles will be equipped with recoverage of break-energy, so
the "end-use" of energy in transport is limited to the unavoidable
friction losses in transport (except for aviation). This increase is
expected to happen until 2050. Most of the changes are only expected
2030-2050, and the efficiency increase 2000-2030 is only expected
to be 22%. Faster improvements in transport efficiencies would be possible.
Growth
Factors
The growth of energy services, i.e. heated floor space, transported goods
and people, energy consuming production, is expected to continue for
2-3 decades and then level off for most sectors towards the end of the
50-year period of the vision. Assumed growth in activities for Lithuania:
·
Floor space, households: 5% in total 2000 – 2010 following current
trends then increasing to 0.9%/year until 2020 and then levelling off
to 0.75%/year, so the growth is still higher after 2010 than in the period
2000 – 2010. In this way the living space in 2050 will be 40% larger
than in 2000
·
Floor space service sectors: 15% in total 2000 – 2010 following
current trends, the same increase (15%) in the period 2010- 2020, then
growth reduced to 1%/year 2020-2040 and then remaining stable on a level
60% above the 2000 level.
·
Electric appliances in households and service: 25% increase for households
and 50% increase for service sector in the period 2000 – 2010 following
current trends, then increase similar to floor space, reaching a level
in 2050 that is 60% higher than the 2000 level for households and 80%
higher for service sector.
·
Industry: doubling of production volume 2000 – 2010 following current
trends, then stable on the new higher level until 2050. Increase in electricity
service demand of 30% 2000 – 2010 following current trends, then
further increase to 40% above the 2000-level in 2020 and then stable.
·
Personal transport: the vision includes more than a doubling of private
car use 2000 – 2030, following current high growth (a 222% increase).
Then we expect a stabilisation while rail and bus use is expected to
increase 3 times, in spite of the downturn in passenger train passenger
since 2000 (they reduced 31% 2000 – 2007 and is expected to decrease
further 2% until 2010 before the turning point).
· Freight transport: the vision includes a 4 times increase in the period
for road transport and a 3.25 times increase for rail and water transports,
based on current strong growth. Pipeline transport is expected to decrease
30% with decreased transport of fossil fuels and a small development
of hydrogen pipelines.
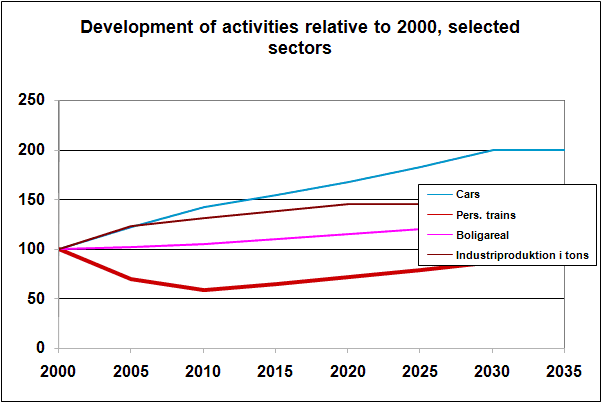
Graph: Development
of selected activities 2000-2050 for Lithuania
Renewable Energy
As a fraction of
primary energy, renewable energy use is expected to reach almost 12%
in 2010, 31% in 2020, 38% in 2030, 60% in 2040 and over 95% in 2050.
For electricity the renewable share is below the share of primary energy
2000-2010, but then will change until 2020, where it will be 72% and
increasing.
The most important developments are in windpower and biomass including
important use of agricultural land for biomass plantations, and use of
straw for heating. The biomass will be used for heating and for combined
heat and power (CHP) production. The use of agricultural land for energy
plantations for solid biomass is expected to be 2500 km2 until 2030 (half
of the land currently unused or with low production).
Also increase use of solar heating, solar PV, geothermal and small hydro
is included in the vision.
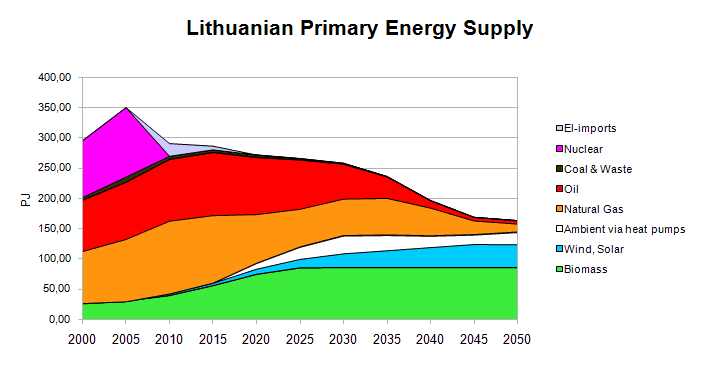
Graph: Change of Energy Supply, following Vision2050
Nuclear and Fossil Energy
Nuclear energy is expected to be phased out as the current nuclear reactor
in Ignalina is stopped in 2009. Fossil fuel use is expected to grow
until 2010 and then gradually be phased out until 2050.
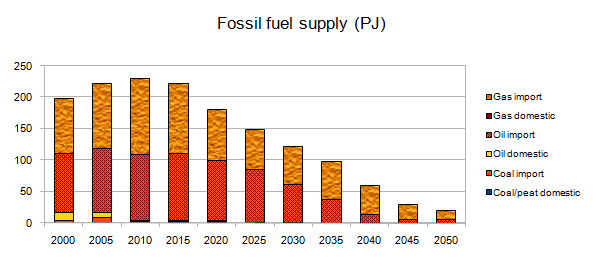
Graph: Fossil fuel development for Lithuania, according to Vision2050
Energy Conversion,
Hydrogen& Heat Pumps
The energy conversion system will also have to be changed. The electric
grid is likely to increase in importance, because electricity will also
be used for transport, directly or via conversion to hydrogen. The increasing
dependence on intermittent electricity supply makes it necessary to have
energy storage in some forms and maybe flexible electricity consumption.
Analysis shows that the current hydro pump storage will be sufficient
until 2030, maybe longer.
Gas networks are expected to have decreasing importance. They might play
a role for transportation of hydrogen or biogas, but probably not for
long-distance transport.
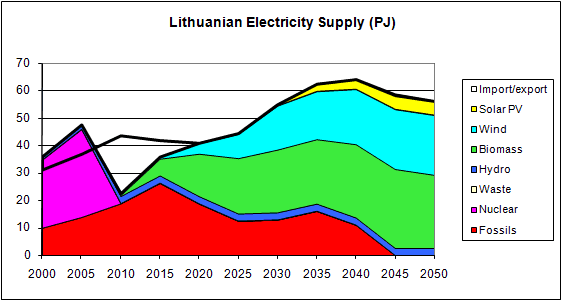
Graph: Development
of electricity production and sources, following the vision. The
line for import/export shows export until 2010 with the line below
the top of the sources.
An evaluation of
the hourly variation of electricity and heat loads and the windpower
production was made on the EnergyPlan model for the year
2020, with input data for the vision's energy balance for 2020 (2006
version) and with variations from typical Danish conditions. The results
were that
CHP
would cover 67% of electricity production, windpower 21%, hydro 7%
and power-only plants 5%. Of the district heat load, CHP would cover
55%
while the rest would be from heating plants. There would be no critical
electricity excess or lack of electricity in any hours, but electricity
export in some periods with high windpower. If the export is not possible,
windpower or CHP production could be reduced in these hours. The results
are consistent with the above results that is based on yearly energy
balances.
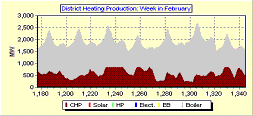
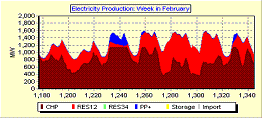
Graphs: Detailed
output (district heating and electricity) from the EnergyPlan model
for winter weak with high windpower production
(Dark red is energy from CHP plants, grey is heat from boilers, clear
red is windpower+hydro, blue is power-only plants)
The EnergyPlan is developed by prof. Henrik Lund et.al. Aalborg University, Denmark, see www.energyplan.eu
Energy Trade
Energy trade is expected to be much less than today, only a moderate
electricity exchange is expected. Electricity exchange with little
net import or export is likely to continue, to exchange electricity
from renewable sources such as hydropower (currently imported from
Latvia on seasonal basis) and wind power.
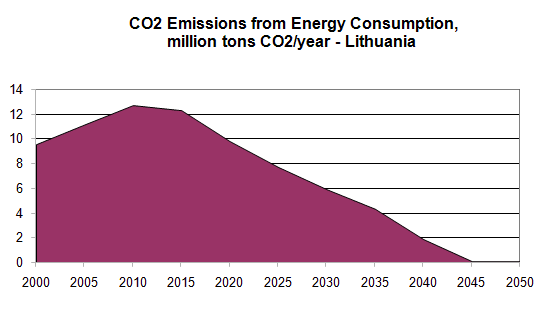
Graph: Phase out of CO2 emissions
The assumptions used in the vision are described in more details in the documents:
- Background note for the Vision, (pdf, 98 kB) December 2010, INFORSE-Europe
-
Actions for Sustainable Energy Development for Lithuania until 2020 (pdf,
83 kB)
INFORSE-Europe & Atgaja, December 17, 2008.
- Sustainable Energy Strtegy and Vision in Lithanian, at Atgaja's
homepage
Sustainable Energy Vision 2050, published in 2006 in Lithuanian.
Download as
pdf file.
- Vision for a Sustainable Energy Development for EU
The work on this
paper and the sustainable energy vision for Lithuania is partly paid
by funding received from the European Commission and from Nordic Council
of Ministers;
but it expresses the findings and the views of the authors and of INFORSE-Europe
and not necessarily of the funders.
The
European Commission
is not liable for use of the information.
![]()
Previous (2006) vision available as pdf-file (63 kB) here