![]()


| About Us | Contact Us | Contact Database | Support Us |
Sustainable
Energy Solutions to Reduce Poverty in South Asia
-
MANUAL-
GUIDELINES:
Choosing the Right RET Solutions
Without energy, development is hardly possible, and
the goals of developing rural areas and reduce absolute poverty by
half cannot be reached. For the countries in the South Asian region,
the energy imports are increasingly costly, and meeting the import
needs of fossil fuel for the developing countries in the coming years
could become more and more difficult. Fortunately there are ways where
local energy sources and efficient use of energy can be combined to
meet development needs.
An important task for each area, village, or even family, is to choose
the best solutions among the many options available. They already spend
money for energy for light, radios, etc. as well as time to collect
and dry fuel etc.
The question is how they can spend money and time
for energy supply more efficient in the future. In this way they can:
- Get energy services cheaper than before. Thus there will be more money for consumptiom.
- Creation of new work places (this gives a rise in welfare if some people are unemployed) producing energy producing equipment and using renewables and local fuels in stead of importing fuels into the village. Local labour force and local fuels will then replace purchased fuels and salaries will stay in local business.
- Reducing the environmental problems and thus reduction of health problems, such as less smoke in the kitchen.
- Developing technologies, learning to use new technologies and achieving new skills.
To choose the right solutions they need
to calculate and estimate the consequences for the options they have.
This can be done in a number
of steps:
2.1 Discussion of Local Problems and Resources
The best energy solutions differ widely from place to place, depending on local problems and resources. The process must start with discussions on local problems for development, involving those that will be covered by the proposals, local leaders, local business and administration etc. It is important to discuss:
-
What are the main current and potential problems regarding energy supply (e.g. expensive energy, unstable supply, smoke from cooking, etc.)?
-
For whom the proposals and plans are made?
-
Which consequences are needed to analyze?
-
What are environmental problems in the area (such as deforestation, lack of fuel wood, drought, etc.)?
-
What are major social problems in the area (illnesses, food shortage, illiteracy, etc.)?
-
What are available financial resources and people’s ability to pay for energy?
-
What are main objectives for development in the area (such as increased employment, increased local independence of energy imports, stop environmental degradation, improved village facilities, improved security, etc.)?
The discussions should lead to conclusions for each issue and pave
the way for the next phases of the development.
2.2 Status of Energy Balance and Local Energy Resources
The “energy balance” of
a village or family is the abbreviation used for energy consumption
and sources. All types of energy are converted
to same unit for comparison, and estimates of efficiency are included.
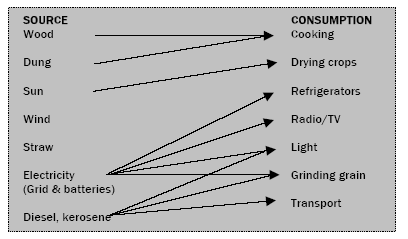
Examples of sources and consumption are shown in box aside. Each arrow shows the present flow of energy. Some sources have many
uses, such as electricity, while other sources have no current use
such as wind and straw. When the energy flows are found, their size
should be found as precise as practical possible.
This could be as
shown in the box below:
-
50 families collect 4 kg wood daily for cooking, 200 kg/day
=
72 t/year
= 324,000 kWh/year - 30 families use 2 kg dry dung daily for cooking, 60 kg/day = 22 t/year = 65,000 kWh/year - 25 families use 1 kg agricultural residues for cooking, 25 kg/day, 9 t/y. = 36,000 kWh/year - 5 families use one gas bottle (14,5 kg gas) per year for cooking, 72 kg/year = 800 kWh/year - 50 families use 4 batteries per month each (2 D-size, 2 AA-size), 2400 /year = 36 kWh/year - 5 families use 25 kWh/month of grid electricity each, 50 kWh/month = 1500 kWh/year - Health clinic + village head’s office uses 75 kWh/month grid electricity = 900 kWh/year - Village grinder use 400 kWh during the season = 400 kWh/year - 45 families use 2 ltr/month kerosene for light each, 1080 ltr/year = 10,800 kWh/year - Village grinder uses 1000 ltr. diesel per year at power outage = 10,000 kWh/year - A tractor in the village use 6000 ltr/year = 60,000 kWh/year |
Next step is to divide use of electricity into use for light, radio/TV,
etc. (see Annex-A). Then an energy balance for the village can be
made, (see Annex-A).
The main energy input and uses from the energy balance are shown in Figure.2.1.
The total energy consumption
in the village is 509,000 kWh (509 MWh), as calculated in annex
A.
The right column is end-use
energy that gives an overview of how much the consumption needs to
be without losses in consumption.
It is clear from the energy balance that current energy use is mainly
for cooking and heating. It is also clear that the energy use is inefficient:
most of the energy, coming from the wood, diesel, electricity, etc.,
is lost in the conversion to heat in food, movements of the tractor,
light, etc.
Figure.2.1: (Energy
in 1000’s of kWh
=MWh/ year), total 187 MWh/year |
From the energy balance can be calculated energy costs,
workload and CO2 emissions for the fuel and electricity, based on prices
for batteries, grid electricity, diesel, kerosene, and what (some)
villagers pay for firewood. It is also calculated how much of this
stays in the village as payment and profits to people. Calculations
are shown in Annex-A.
The costs for the villagers and the employment
effects of the current energy use is:
- Total energy costs for village: Rs. 286,000 of which Rs. 16,000 stays in the village
- Total work in village: 130 hours/day, mainly to collect wood & dung
(Note: all figures from Annex A are rounded to 1000’s of Rs. & to 1000’s or 100’s of kWh in this chapter)
Another part of the basis for a local energy strategy is an estimation of available resources. Summary of resources could be:
- stream available for pico hydropower plant, 2 kW permanent power.
- dung from 60 cows and 60 buffaloes, partly used today as fuel.
- dry land that could be planted with energy crops, 2 hectare (20,000 m2).
- straw, 20 tons/harvest.
-
solar energy, 1800 kWh/m2
2.3 Elaboration of Future Energy Balance (Business as Usual- BAU)
The present situation in the village is not satisfactory. In the future all households would like to change to grid electricity and use the same energy that the three households with grid electricity use today. They find that they could afford the electricity instead of buying batteries and kerosene, but they cannot necessarily afford the connection fee. In addition the village will invest in a water pump for drinking water, a cold storage, and 4 street lamps. No investment in energy efficiency or local energy supply is expected in the BAU situation.
The energy consumption of the new situation is entered in the table for the energy balance in Annex-A. In this example consumption of grid electricity goes up while consumption of kerosene is stopped and battery use reduced to half.
The future “BAU” energy use
is calculated in Annex A and shown in Figure.2.2.
Since no changes
were made to
energy for cooking
and heating that are the largest types of energy consumption, little
change can be seen in the figure, total energy input increases to 514,000
kWh = 514 MWh.
From the detailed energy balance (see Annex-A) can be
seen that electricity consumption increases from 1900 kWh/year to 17,500
kWh/year and consumption of kerosene goes down with 1080 ltr/year.
The end-use energy (net energy use) for light and Radio/TV goes up
from 410 kWh/year to 3300 kWh which shows that people would have much
more light and radio/TV if the BAU situation is realized.
Figure.2.2:
Energy in 1000s of kWh= MWh/year)
|
The results regarding costs and work for the BAU situation are:
-
Total energy costs for village (annual): Rs. 419,000 which Rs. 11,000 stays in the village.
-
Total work in village: 130 hours/day, mainly to collect wood and dung.
With these changes the annual energy costs will go up with Rs. 146,000 (almost Rs. 3,000 per family) because of the increased use of electricity.
The expensive batteries and kerosene are exchanged with grid electricity; but the use of light, refrigeration and radio/TV goes up. The BAU has investments, mainly in electric grid/grid connection which also will increase the total cost for the village. The part of the cost that stays in the village is going down because the local shop sell less batteries. The business as usual (BAU) forecast does not include improvements, such as cleaner kitchens or more efficient energy use.
Important discussions are if the village can afford this scenario and what benefits and problems that it has (e.g. is it realistic and desired to rely on grid electricity with outages).
2.4 Calculations
for Single Technology
A number of sustainable solutions are now suggested. For each of these solutions, the costs and benefits are calculated. Examples:
Pico-hydro, 2 KW:
Investment: Rs. 200,000
Annual costs: Rs. 5000
Energy production: 16,000 kWh/year. Replaces grid
electricity at Rs. 4 per KWh
Simple payback: 3.4 years
Additional effects: more reliable
than grid,
avoids power shortages, needs local electric grid costing additional
Rs. 200,000.
Family biogas plants:
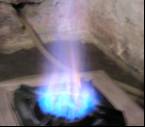
Investment: Rs. 35,000
Annual costs: Rs. 2000
Energy production: 12 KWh/day (2 m3 gas/day). Replaces
firewood and dung, saves work of 3 hours/day
Additional effect: Cleans kitchen facility.
Solar street lamps:
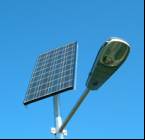
Investment: Rs. 10,000
Annual costs (replacement
battery every 3 yr): Rs. 400. Extra costs compared with normal street
lamps:
Rs. 3,000;
Saves 350 KWh/yr at Rs. 4 per KWh
Simple payback: 3 years
Additional
effects: Works during power cut.
Efficient light bulbs for households: [11 Watt replaces a 40 W normal
light bulb]

Investment: Rs.
250
Annual cost: 0 (during lifetime of 6 years); Saves 44 KWh/yr
(4 hours use/day) and one normal bulb (Rs. 30)
Simple
payback: 1.2 years
Additional effects: none.
Solar home systems:
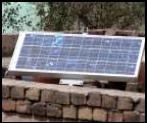 Investments: Rs. 45,000
Annual cost (replacement battery every
5 yr): Rs. 1400; Produces 100 KWh/year, can provide electricity for
4 efficient
light bulbs 4 hours/day + Radio/TV
Simple payback compared with
kerosene (2 ltr/month) and batteries (3 per month): 35 years, but
only 11 years if two families share a system.
Simple payback compared
with grid electricity: 45 years, but only 30 years if savings in
local grid is included. (This example of a large solar home system
is not economic with these calculations, but it has other advantages:
it gives better light and electricity than kerosene and more reliable
electricity than grid in many places)
Jatropha plant field of 2 ha to replace oil, change truck to run
on Jatropha oil, oil expeller press + conversion of truck:
 Investment: Rs. 150,000
Annual cost: picking 4 tons of
nuts/year at 5 kg/hour = 800 hours/year of work at Rs. 15/hour
= Rs. 12,000
Production: 1400 ltr. Jatropha oil with local
rainfall conditions, replaces 1300 ltr, diesel oil at Rs. 30/ltr
= Rs. 39,000/year.
Simple payback: 5.6 years + 3 years when
the bushes grow up.
2.5 Calculations of Different Mixes of Technologies
Based on the above descriptions of solutions, some combination of
solutions is chosen for further discussions. Examples could be:
Hydropower + efficient light bulbs:
The reason for this is the good economy of the micro-hydro; and that
the limitation of the hydro capacity gives a need to save electricity
compared with the business as usual scenario, where electricity demand
is above the hydro production (16,000 kWh/yr). Investment (including
209 efficient light bulbs: 4 per family (9 Watt each) + street lamps,
clinic etc.) Rs. 260,000 (rounded). To that figure must be added investment
in wires between houses (the wires are also necessary in the business
as usual-BAU scenario), e.g. Rs. 200,000) and capacity limiters, allowing
e.g. 40 Watt per house as maximum use.
An extended solution is to combine
the pico-hydro with improved chulhas for efficient cooking with wood
and phase out use of dung and agricultural
waste as fuels. With this, the demand for wood fuel is reduced by 1/3,
and the demand for dung and agricultural waste etc., is reduced to
zero. The energy use with this combination is shown in Figure-2.3.
The detailed energy balance and investment calculations are shown in
Annex-A. The total energy consumption (293,000 kWh = 293 MWh per year)
is lower than the “BAU” example because of the efficient
chulhas (cook stoves) and the efficient light bulbs. The net energy
use (about 70 MWh/year) is about the same as in the “BAU” example-
so the improvements with more lights etc., would be the same. In addition
the proposal includes improved kitchen facilities and stopping the
use of dung as fuel, so it can be used for improving agriculture.
Figure.2.3:
Energy in 1000s of kWh =MWh/year
|
The results with this example regarding energy cost and work are (from Annex A) given as under:
- Investments: 500,000 Rs. of which cash 170,000 Rs. cash, loans 290,000 Rs. and subsidy 50,000 Rs. subsidy (it is assumed that subsidy will be available)
- Total annual energy costs for village: Rs. 203,000 of which Rs. 14,000 stays back in the village (this includes repayment of loans of 32,000 Rs.)
- Total work in village: 89 hours/day, to collect wood + two hours/day to manage pico-hydro and the electric grid
In the above example the costs are only 71% of the present costs for energy. This includes estimated repayment of pico-hydro, mini-grid and efficient light bulbs; but not investments chulhas and improvements (such as cold storage and street lights) that the villagers have to finance in other ways.
Biogas plant and solar:
Another example would be to combine biogas with solar energy. Biogas
plants can solve cooking needs and light with gas lamps while and
solar can give electricity for Radio/TV. To supply the village, 40-50
family biogas plants are needed with a combined investment of Rs.
690,000. Calculation is shown in Annex-A.
Other examples:
Other systems can also be chosen for calculations such as solar home
systems, solar street lamps, Jatropha oil, etc.
When a sufficient number of alternatives are made a decision should
be taken with priorities of the different solutions. It is not yet
time to make final decisions. They can only be made after an action
plan is made. An important part of discussing priorities is that solutions
should be presented for and discussed with the people in the village.
Then priorities can be made with solutions from the different alternatives.
Priorities could be:
1. hydropower and development of local grid
2. development of biogas plants
3. introduction of efficient light bulbs
For each of the suggested solutions should be made a more detailed feasibility study, looking at factors such as uncertainties, variations over the year of demand and supply, subsidies, etc.
2.6 Elaboration of an Action Plan
The action plan should describe how the solutions with the highest priorities can be introduced over a period, how they can be financed, and what the villagers should commit to. It should also propose organizational solutions, uncertainties, and a financing plan.
Then it is time to present the solutions for the people to be involved so they can make their decisions and start improving their situation¤.
¤ Disclaimer: Basic data for the example in this chapter are mostly taken from surveys of 12 eco-villages in the Bharatpur district in Rajasthan state of India; but the example does not fully represent any of the existing villages. All use of the methods described in this chapter must be based on the information collected from the actual villages that are analyzed and on local information for costs of energy, equipments etc.