|
ENERGY TODAY
Most of the energy we use today comes from fossil fuels. Coal, oil, and
natural gas are all fossil fuels created several millions of years before by the
decay of plants and animals. These fuels lie buried between layers of
earth and rock. While fossil fuels are still being created today by underground
heat and pressure, they are being consumed much more rapidly than they are
created. For that reason, fossil fuels are considered as non-renewable; that is,
they are not replaced as soon as we use them. So, we will run out of them
sometime in the future. Moreover burning fossil fuels leads to pollution and
many environmental impacts. Because our world depends so much on energy, we need
to use sources of energy that will last forever. These sources are called
renewable energy. Moreover these renewable energy sources are much more
environmentally friendly than fossil fuels when they are burned.
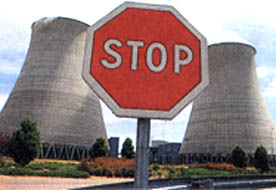
Among fossil fuels somehow special character has uranium-nuclear fuel which can be exhausted in less than 100 years, but in so called breeder reactors it can multiply and last much more. Nevertheless problems with radioactive waste, which will present a danger for millions of years and the the impact of accident in Chernobyl, which showed a risk connected with nuclear energy, most governments in industrialised world are now abandoning nuclear power completely. This development continues despite the fact that nuclear energy, which produce almost zero emissions of greenhouse gases, can be somehow a solution to global climate change (see bellow). Emissions of greenhouse gases are now recognised as the most important force behind the efforts to decrease consumption of fossil power.
WHY DO WE NEED THE CHANGE IN ENERGY
USE ?
The main problem isnt that we use energy, but how we produce and consume
energy resources. As long as we continue to cover our energy needs primarily by
combustion of fossil fuels or nuclear reactions, we are going to have the
problems, the environmental impacts, social and sustainability problems. What we
really need are energy sources that will last forever and can be used without
pollution of the environment.
![]() ENERGY
CONSUMPTION SUSTAINABILITY PROBLEM
ENERGY
CONSUMPTION SUSTAINABILITY PROBLEM
 Each year,
the equivalent of approx. 10 000 million tons of coal is consumed on earth as
energy. About 40 % from this is based on oil and together with coal and natural
gas more than 90 % of the total energy consumption result from carbon atoms in
these fossil fuels. The consequence will be a global warming (greenhouse effect)
and the lack of resources in the future.
Each year,
the equivalent of approx. 10 000 million tons of coal is consumed on earth as
energy. About 40 % from this is based on oil and together with coal and natural
gas more than 90 % of the total energy consumption result from carbon atoms in
these fossil fuels. The consequence will be a global warming (greenhouse effect)
and the lack of resources in the future.
History of energy consumption
Ancient discovery of fire and the possibility of burning wood made available,
for the first time, fairly large amount of energy for mankind. Later (4000 and
3500 years B.C.) after the first sailing ships and windmills were developed and
the use of hydropower began via water mills or irrigation systems, cultural
development began to accelerate. For several thousands years human energy
demands were covered only by renewable energy sources sun, biomass, hydro
and wind power. It was only until the start of industrial revolution and the
ability to transform heat into motion, when energy consumption and industrial
development accelerated rapidly. The industrial revolution was a revolution of
energy technology based on fossil fuels. This occurred in stages, from the
exploitation of coal deposits to oil and natural gas fields on a global scale.
It has been only half a century since nuclear power began being used as an
energy source. After this fossil-based era world nears the beginning of another
major transition, away from fossil fuels and towards renewable energy sources
once again. Fundamental shift in the energy picture can be found in the enormous
increase of energy demand since the middle of the last century. That increase is
the result not only of industrial development but also of population growth.
World population grew 3.2 times between 1850 and 1970, per-capita use of
industrial energy increased about 20-fold, and total world use of industrial and
traditional energy forms combined increased more than 12-fold.
![]()
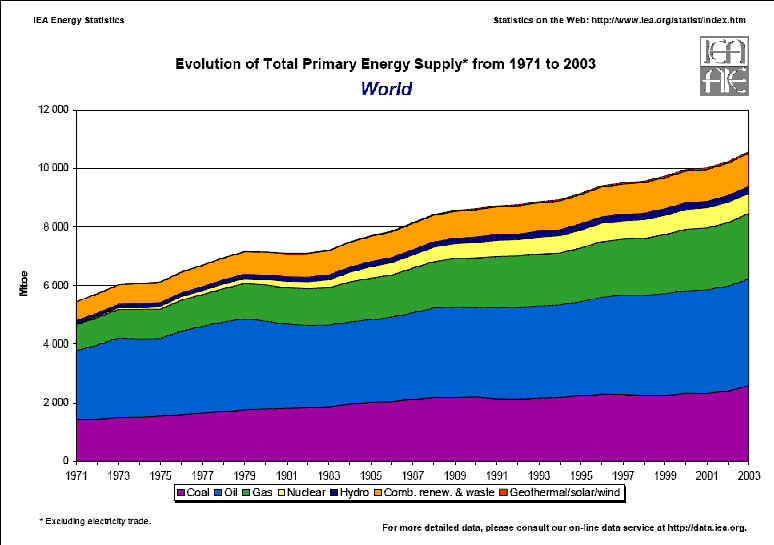
HOW MUCH ENERGY DO WE USE ?
Today fossil fuels such as coal, oil and natural gas account for 90% of total
primary energy supply. Estimated total world consumption of primary energy, in
all forms (including non-commercial fuels like biomass), is a equivalent of
almost 10.000 million tonnes of oil (mtoe) per year. World primary energy
consumption increased by 2.7% in 2005, below the previous years strong growth
of 4.4% but still above the 10-year average.
Mtoe |
% |
% |
% |
% |
% |
% |
|
| All Fuels | |||||||
| Solid fuels | |||||||
| Oil | |||||||
| Natural gas | |||||||
| Nuclear | |||||||
| Renewables | |||||||
| Hydro | |||||||
| Geothermal | |||||||
| Wind/Solar | |||||||
| Biomass | |||||||
| Source: Commission services, Organisation for Economic Co-operation and Development | * Includes Hong Kong | ||||||
World primary energy consumption

SEE MORE
ENERGY STATISTICS (primary energy, oil, gas, nuclear and hydro) ![]()
![]()
FUTURE TRENDS![]()
 According
to official estimates, the energy consumption will continue to increase as it
has been doing in the recent past, leading to increasing energy supply problems
and increased environmental problems.
According
to official estimates, the energy consumption will continue to increase as it
has been doing in the recent past, leading to increasing energy supply problems
and increased environmental problems.
One important driver for increased energy consumption is the increasing population. The world population was approximately 6 billion people in 2000. The UN estimates of population trends foresees that it will continue to increase to around 8 billion by 2025, but stabilising towards the year 2100 at somewhere between 10 and 12 billion people. Most of that increase will be in the less developed countries.
The official forecast from the International Energy Agency, World Energy Outlook 2004 is that consumption throughout the world continue to grow over the next two decades, with most growth in Asia. World energy demand in 2020 is projected to reach nearly 600,000 PJ (14,400 Mtoe)
![]() The
expected increment in total energy demand between 1995 and 2020 - about 230,000
PJ (5,500 Mtoe) - would match the total world energy consumption recorded in
1971, just before the energy crisis of 1973. Two-thirds of all energy growth
will occur in developing economies and economies in transition, with much of
that growth concentrated in Asia. In 2002 energy use in industrialised countries
(OECD countries + former socialist countries) exceeded total consumption in the
nations of developing countries by 12%. By 2030, energy use in industrialised
countries, is expected to exceed developing countries with only 2%.
The
expected increment in total energy demand between 1995 and 2020 - about 230,000
PJ (5,500 Mtoe) - would match the total world energy consumption recorded in
1971, just before the energy crisis of 1973. Two-thirds of all energy growth
will occur in developing economies and economies in transition, with much of
that growth concentrated in Asia. In 2002 energy use in industrialised countries
(OECD countries + former socialist countries) exceeded total consumption in the
nations of developing countries by 12%. By 2030, energy use in industrialised
countries, is expected to exceed developing countries with only 2%.
![]() According
to the IEA World Energy Outlook, oil use is expected to exceed 5000 Mtoe in
2020, a consumption rate almost 50 % larger than in 1995. Oil trading patterns
are expected to shift markedly as oil consumption in Asia Pacific areas far
outpaces domestic production gains, leading to a large increase in imports from
Middle East suppliers. World-wide, coal use is projected to reach 3200 Mtoe by
2020, almost 50% above consumption in 1995. Growth in coal use will be
regionally concentrated, occurring for the most part in India and China.
According
to the IEA World Energy Outlook, oil use is expected to exceed 5000 Mtoe in
2020, a consumption rate almost 50 % larger than in 1995. Oil trading patterns
are expected to shift markedly as oil consumption in Asia Pacific areas far
outpaces domestic production gains, leading to a large increase in imports from
Middle East suppliers. World-wide, coal use is projected to reach 3200 Mtoe by
2020, almost 50% above consumption in 1995. Growth in coal use will be
regionally concentrated, occurring for the most part in India and China.
![]() Natural
gas is expected to have the highest growth rate among fossil fuels, gaining
share relative to oil and coal with a growth of 2.3% per year. By 2015 natural
gas consumption on will exceed the total oil consumption recorded for 1995, at a
level equivalent to two-thirds of the oil consumption projected for 2015.
Natural gas consumption in 1995 was only about 55 percent of oil consumption.
Natural
gas is expected to have the highest growth rate among fossil fuels, gaining
share relative to oil and coal with a growth of 2.3% per year. By 2015 natural
gas consumption on will exceed the total oil consumption recorded for 1995, at a
level equivalent to two-thirds of the oil consumption projected for 2015.
Natural gas consumption in 1995 was only about 55 percent of oil consumption.
![]() According
to IEA prediction only about 13 % of projected growth in energy demand over the
next two decades will be served by renewable energy. In fact, the renewable
energy share of world energy consumption declines from 13.5 % in 2002 to 13.3 %
in 2020. Nuclear energy use is expected to remain with a stable production,
leading to a falling share of total energy supply. Thus, world carbon CO2
emissions are projected to increase steadily to reach a level 39% above the 1990
level by 2010 and 66% above 1990 by 2020. The Climate Change Convention of 1992
commits all signatories to search for and develop policies to moderate or
stabilize carbon emissions and the Kyoto Protocol commits most industrialised
countries to reduce their emissions with at least 5% 1990-2010. However, even if
all the developed countries were able to achieve stabilization or reductions of
their emissions relative to 1990 levels, overall world CO2 emissions
would still rise.
According
to IEA prediction only about 13 % of projected growth in energy demand over the
next two decades will be served by renewable energy. In fact, the renewable
energy share of world energy consumption declines from 13.5 % in 2002 to 13.3 %
in 2020. Nuclear energy use is expected to remain with a stable production,
leading to a falling share of total energy supply. Thus, world carbon CO2
emissions are projected to increase steadily to reach a level 39% above the 1990
level by 2010 and 66% above 1990 by 2020. The Climate Change Convention of 1992
commits all signatories to search for and develop policies to moderate or
stabilize carbon emissions and the Kyoto Protocol commits most industrialised
countries to reduce their emissions with at least 5% 1990-2010. However, even if
all the developed countries were able to achieve stabilization or reductions of
their emissions relative to 1990 levels, overall world CO2 emissions
would still rise.
![]() Per
capita energy use in the worlds industrialized economies, which far exceeds
the levels in newly emerging economies, is expected to change only moderately in
the next two decades. In some emerging economies (for example, India and China),
per capita energy use may double. Even with such growth, however, average per
capita energy use in the developing countries will still be less than one-fifth
the average for the industrialized countries in 2020.
Per
capita energy use in the worlds industrialized economies, which far exceeds
the levels in newly emerging economies, is expected to change only moderately in
the next two decades. In some emerging economies (for example, India and China),
per capita energy use may double. Even with such growth, however, average per
capita energy use in the developing countries will still be less than one-fifth
the average for the industrialized countries in 2020.
![]() In
some official long-term forecasts, consumption of oil as the principal source of
commercial energy today, will start to decline after the transition phase (after
2030). It is expected that natural gas will continue to be used as long as price
and availability are satisfactory but as reserves reduce and gas prices rise,
coal (which is usually less expensive than natural gas and its international
prices are less likely to rise) will command a greater proportion of the market.
To maintain energy levels and because of world-wide environmental concerns some
experts predict that coal will have to be utilized cleanly, where gasification
process will be the most environmentally friendly way of its future utilization,
combined with capture and underground storage of CO2.
In
some official long-term forecasts, consumption of oil as the principal source of
commercial energy today, will start to decline after the transition phase (after
2030). It is expected that natural gas will continue to be used as long as price
and availability are satisfactory but as reserves reduce and gas prices rise,
coal (which is usually less expensive than natural gas and its international
prices are less likely to rise) will command a greater proportion of the market.
To maintain energy levels and because of world-wide environmental concerns some
experts predict that coal will have to be utilized cleanly, where gasification
process will be the most environmentally friendly way of its future utilization,
combined with capture and underground storage of CO2.
![]() Opposite
the official forecasts of IEA, EU and USA, many organisations have proposed a
rapid increase in renewable energy use combined with strong increase in energy
efficiency. With such transitions to sustainable energy systems, demands for
fossil fuels and nuclear energy would gradually reduce. The report for the UN
Solar Energy Group for Environment and Development from 1993 suggests that using
technology already on the market or at the advanced engineering testing stage,
by the middle of the 21st century renewable energy sources could
account for 60 percent of the worlds electricity market and 40 percent of the
market for fuels used directly. The
International Network for Sustainable Energy suggests in its sustainable
energy vision 2050 a global phase out of fossil fuel use until 2050 with a phase
out of nuclear energy until about 2020. INFORSEs vision combines large
increases in renewable energy use with increases in energy efficiency of 2-7
times. The large increases in energy efficiency are based on the potentials to
increase energy efficiency by exchanging present energy consuming technologies
with the best available proven technologies, such as very efficient electric
appliances, houses with mainly passive heating and cooling, transport systems
running on electricity and hydrogen etc. If these solutions are introduced on
large scales, they will be cost-effective compared with the present
technologies. The same is true for the large-scale use of renewable energy that
is proposed with the vision. As a result it is possible to meet the same
requirements as we have today for energy services (heated floorspace, industrial
production etc.) with much less primary energy supply, and also allow some
increases in the living standards.
Opposite
the official forecasts of IEA, EU and USA, many organisations have proposed a
rapid increase in renewable energy use combined with strong increase in energy
efficiency. With such transitions to sustainable energy systems, demands for
fossil fuels and nuclear energy would gradually reduce. The report for the UN
Solar Energy Group for Environment and Development from 1993 suggests that using
technology already on the market or at the advanced engineering testing stage,
by the middle of the 21st century renewable energy sources could
account for 60 percent of the worlds electricity market and 40 percent of the
market for fuels used directly. The
International Network for Sustainable Energy suggests in its sustainable
energy vision 2050 a global phase out of fossil fuel use until 2050 with a phase
out of nuclear energy until about 2020. INFORSEs vision combines large
increases in renewable energy use with increases in energy efficiency of 2-7
times. The large increases in energy efficiency are based on the potentials to
increase energy efficiency by exchanging present energy consuming technologies
with the best available proven technologies, such as very efficient electric
appliances, houses with mainly passive heating and cooling, transport systems
running on electricity and hydrogen etc. If these solutions are introduced on
large scales, they will be cost-effective compared with the present
technologies. The same is true for the large-scale use of renewable energy that
is proposed with the vision. As a result it is possible to meet the same
requirements as we have today for energy services (heated floorspace, industrial
production etc.) with much less primary energy supply, and also allow some
increases in the living standards.
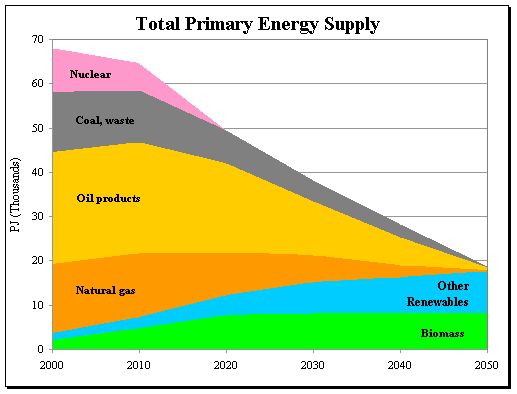
Future total energy demand for the 25
EU-countries, if we follow INFORSEs vision 2050. Unit:
1000 PJ (EJ).
With INFORSEs vision, the global energy demand will be considerably lower than the total renewable energy potential.
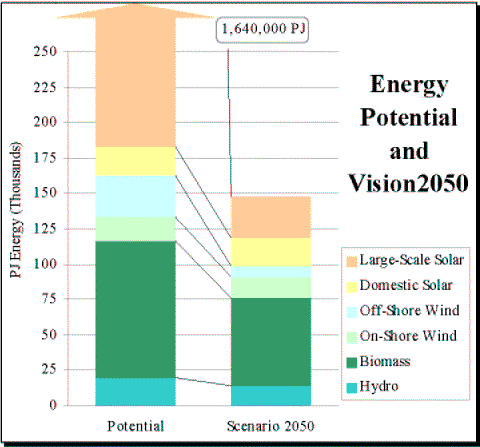
GRAPH: Global energy in 2050 according to INFORSE Vision 2050, compared with global technical renewable energy potential.
With the vision the energy services in the developing countries will increase several times; but the total energy demand will not necessarily increase because of the large potentials for increase in energy efficiency. With the vision it is possible to supply everybody with basic energy needs for cooking, light, etc., and thereby ending the energy part of global poverty.
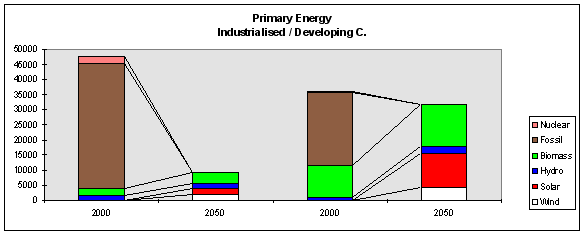
Comparing current global primary energy consumption in 2000 (in PJ, from IEA statistics) with the proposed situation in 2050.
Read more about INFORSEs Vision2050 at http://www.inforse.org/europe.
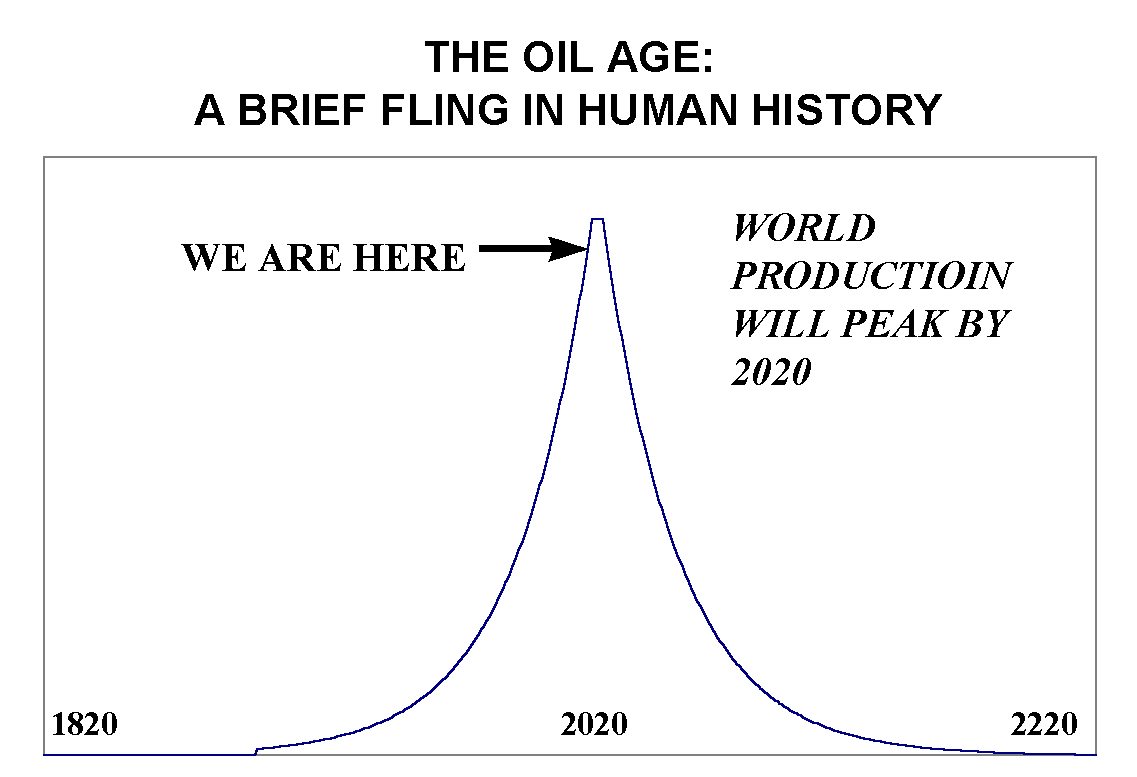
Reserves
of Fossil Fuels - Oil Peak
Fossil fuels are valuable natural energy sources which required several
millions of years for their creation but are now rapidly being depleted. The
prominent worry that fossil fuels will run out was reported almost 30 years ago
by the influential book Limits to Growth. This book reported a series of
computer simulations of future resource use in which world fuel consumption
continued to rise exponentially. The predicted result was an ultimate collapse
in fuel supplies, regardless of the amount of fuel assumed to be available.

 |
The shortage expected in the dramatic concerns of those days do not seem imminent at present. The general principle that the amount of fossil fuels remaining is ultimately limited and cannot last for ever is obviously true, but estimating how long they will last is not a simple process. In any year, newly reported figures for proven reserves of oil, gas and coal are available. Proven reserves are generally taken to be those quantities which geological and engineering information indicate with reasonable certainty can be recovered in the future from known deposits under existing economic and operating conditions. A useful figure of the merit for fuel reserves is the reserve/production ratio. |

![]() Like the fossil fuels,
uranium is also one of the depletable natural resources. If uranium is only used
in a once-through cycle where it is burned in a reactor only once and disposed
as a waste thereafter, confirmed reserves are destined to be depleted in the
next 60 years.
Like the fossil fuels,
uranium is also one of the depletable natural resources. If uranium is only used
in a once-through cycle where it is burned in a reactor only once and disposed
as a waste thereafter, confirmed reserves are destined to be depleted in the
next 60 years.
![]() The reserves/production ratio
for any region also gives an indication of the dependence of that area on more
favoured regions. For example, for oil, the reserve/production ratio was
less than 10 years for Western Europe and for North America it was about
25 years. Obviously, both regions would be in dire straits if they could not
import oil from Middle East, where the ratio is nearly 100 years. The Middle
East has some 60 % of the worlds reserves of oil, and Saudi Arabia alone
contains about 25 %.
The reserves/production ratio
for any region also gives an indication of the dependence of that area on more
favoured regions. For example, for oil, the reserve/production ratio was
less than 10 years for Western Europe and for North America it was about
25 years. Obviously, both regions would be in dire straits if they could not
import oil from Middle East, where the ratio is nearly 100 years. The Middle
East has some 60 % of the worlds reserves of oil, and Saudi Arabia alone
contains about 25 %.
![]() For gas the situation is
somewhat different, because of the massive reserves in the former Soviet Union.
This region holds some 40 % of the worlds reserves of gas, and another 40% of
gas is in the OPEC region. The world as a whole is greatly dependent upon a
limited number of regions which have most of the reserves. The
reserve/production ratio for coal are much larger and much more evenly
distributed. Unfortunately, coal has disadvantages compared to oil and gas. Coal
burning creates more CO2 per unit of energy released than is the case with gas
and oil, and more sulphur dioxide and nitrogen oxides.
For gas the situation is
somewhat different, because of the massive reserves in the former Soviet Union.
This region holds some 40 % of the worlds reserves of gas, and another 40% of
gas is in the OPEC region. The world as a whole is greatly dependent upon a
limited number of regions which have most of the reserves. The
reserve/production ratio for coal are much larger and much more evenly
distributed. Unfortunately, coal has disadvantages compared to oil and gas. Coal
burning creates more CO2 per unit of energy released than is the case with gas
and oil, and more sulphur dioxide and nitrogen oxides.
![]()
OIL
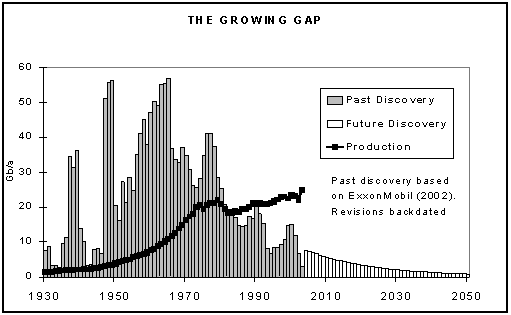
Note Gb/a - giga barrels per year (giga = billion ).
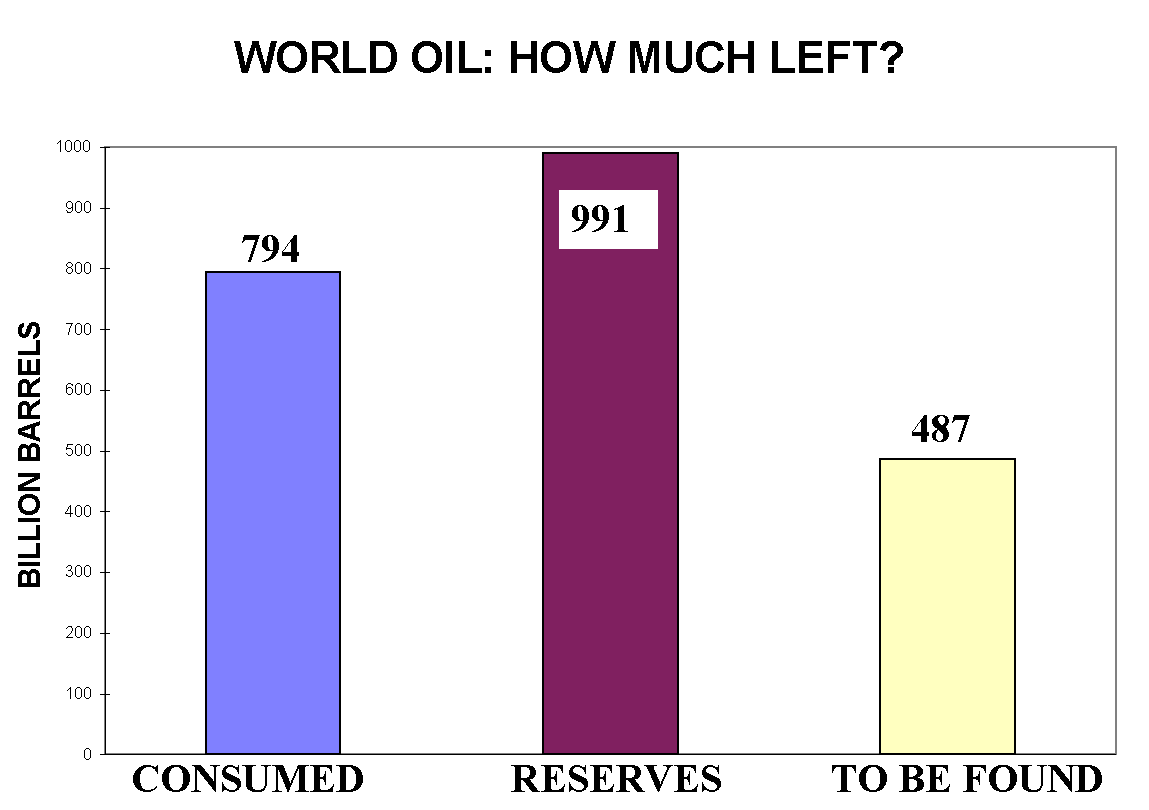
Exploration for oil, the most important fossil fuel today, is a very expensive business. The amount of exploration is dependent upon economic conditions, particularly the price of oil, and upon political conditions. The worlds proven reserves of oil have increased from some 540 billion barrels in 1969 to just over 1000 billion barrels in 2000, but this does not mean that potential reserves are unlimited. The earth has been surveyed in great detail by the oil companies, and the easiest, cheapest and most promising reservoirs have all been found.

NATURAL GAS
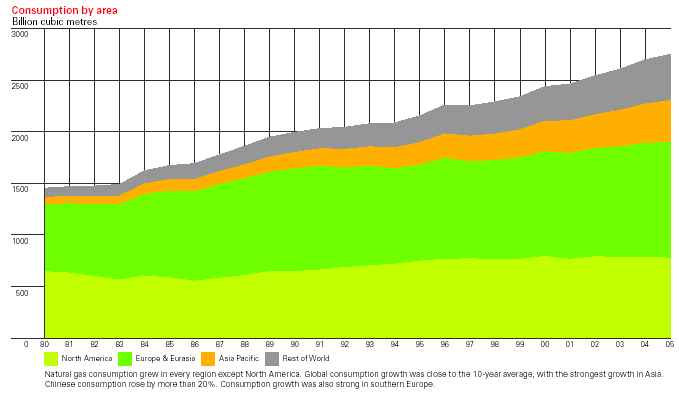
| In 1970, world-wide annual consumption of natural gas was 850 billion cubic meters. Today, annual consumption is over 2000 billion cubic meters and is increasing at 2.3 percent per year. North America was the only region were consumption declined. In the U.S. , the world largest consumer , gas use declined by 1.5%. The world consumption pattern has change in last few years. Not so long ago natural gas was considered as the most promising (cheap, abundant and clean) fuel source, but due to huge price increases in 2005 and the lack of resources mainly in Northern America the situation is changing. |
| Largest natural gas consumption occurred in China, southern Europe and India. It seems clear that the demand for natural gas fuel will increase in the near future but will decline in the second half of the next century. |
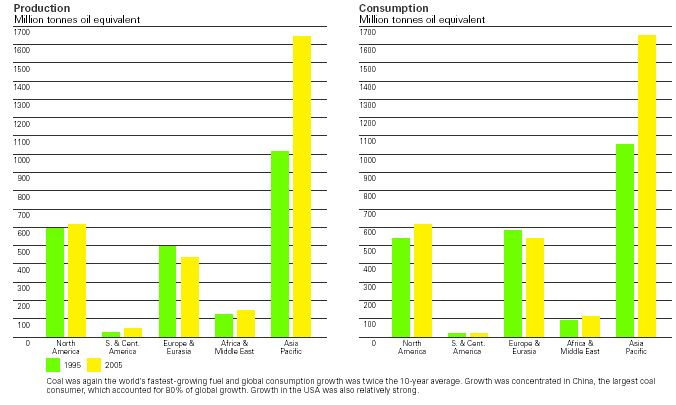
COAL
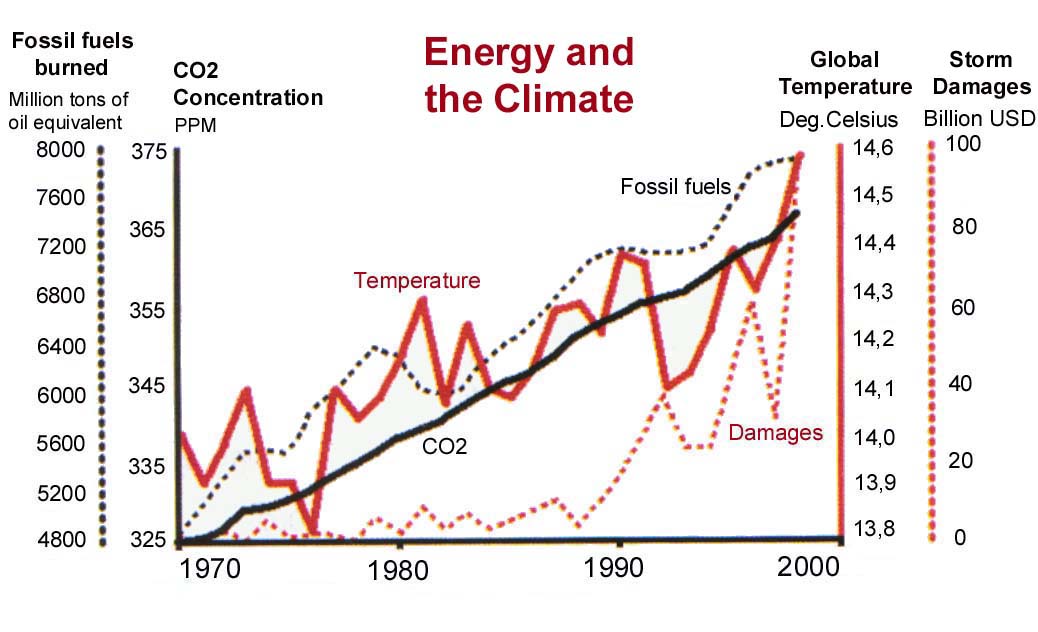
In the year 2005 coal was again the worlds fastest-growing fuel, with global consumption rising by 5%. Consumption in China, the worlds largest consumer, rose by 11%. China accounted for 80% of global growth. Consumption growth in the USA was also above average, while growth in the rest of the world was close to the 10-year average. Due to the sharp increases of oil and gas prices coal became cost effective fuel. This development seems to be very dangerous from the perspective of global warming (see more in chapter bellow). Emissions of carbon dioxide as the main greenhouse gas are the highest coal combustion among all fossil fuels.
![]()
ENVIRONMENTAL
EFFECTS OF ENERGY USE
Most important environmental impacts caused by energy sources are global
climate change and acid rain both of which have the origin in the combustion
of fossil fuels and lead to global or transboundary effects.
CLIMATE CHANGE
Climate
Change : Vital Graphics + IPCC Report ![]()
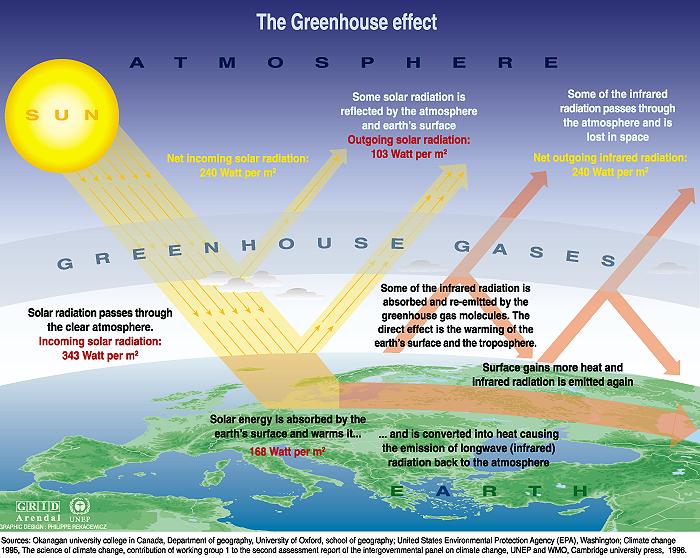
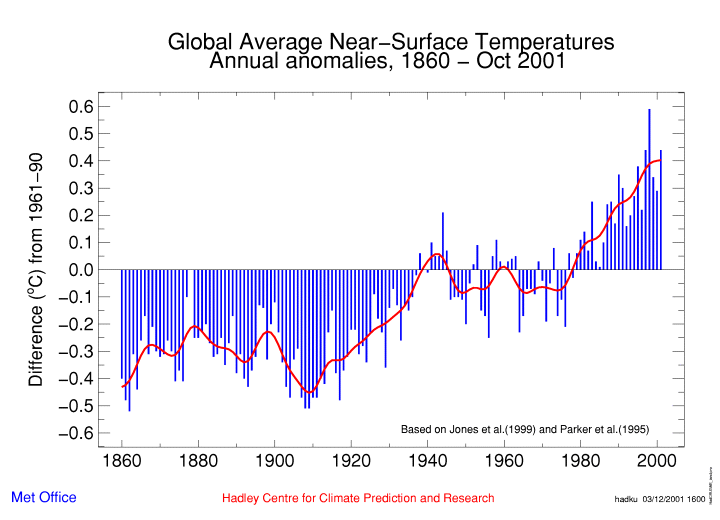
During the last few decades, concern has been growing internationally that increasing concentrations of greenhouse gases in the atmosphere will change our climate in ways detrimental to our social and economic well-being. Climate change or global warming means a gradual increase in the global average air temperature at the earths surface. Abundant data demonstrate that global climate has warmed during the past 150 years. The majority of scientists now believe that global warming is taking place, at a rate of around 0,3 deg. C per decade, and that it is caused by increases in the concentration of so-called greenhouse gases in the atmosphere. The most important single component of these greenhouse gas emissions is carbon dioxide (CO2). The major source of emissions of CO2 are power plants, automobiles, and industry. Combustion of fossil fuels contributes around 80 percent to total world-wide anthropogenic CO2 emissions.
Another source is global deforestation. Trees remove carbon dioxide from the air as they grow. When they are cut and burned that CO2 is released back into the atmosphere. Massive deforestation around the globe is releasing large amounts of CO2 and decreasing the forests ability to take CO2 from the atmosphere. The second major greenhouse gas is methane (CH4). It is a minor by-product of burning coal, and also comes from venting of natural gas (which is nearly pure methane). Different fossil fuels produce different amounts of CO2 per unit of energy released. Coal is largely carbon, and so most of its combustion products are CO2. Natural gas, which is methane, produces water as well as CO2 when it is burned, and so emits less CO2 per unit of energy than coal. Oil falls somewhere between gas and coal in terms of CO2 emissions, as it is made up of a mixture of hydrocarbons. The amount of CO2 produced per unit of energy from coal, oil and gas is in the approximate proportion of 2 to 1,5 to 1. This is one of the reasons why there is a move towards greater use of natural gas instead of coal or oil in power stations, despite the much greater abundance of coal.
HOW GLOBAL WARMING WORKS
 |
The earths atmosphere is made up of several gases, which act as a greenhouse, trapping the suns rays as they are reflected from the earths surface. Without this mechanism, the earth would be too cold to sustain life as we know it. Since the industrial revolution, humans have been adding huge quantities of greenhouse gases, especially carbon dioxide (CO2) to the atmosphere. More greenhouse gases means that more heat is trapped, which causes global warming. By burning coal, oil and natural gas increases atmospheric concentrations of these gases. Over the past century, increases in industry, transportation, and electricity production have increased gas concentrations in the atmosphere faster than natural processes can remove them leading to human-caused warming of the globe. |
THE EVIDENCE
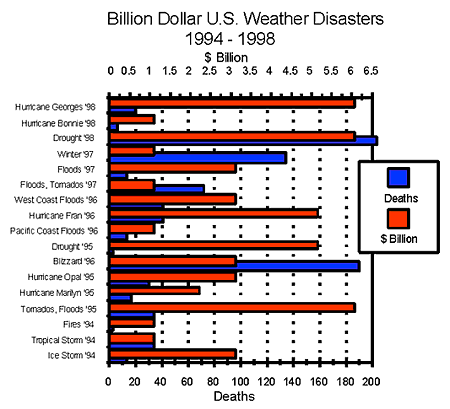
Recently, alarming events that are consistent with scientific predictions
about the effects of climate change have become more and more commonplace. The
global average temperature has increased by about 0.5 deg. C and sea level has
risen by about 30 centimetres in the past century. 1998 was the hottest year
since accurate records began in the 1840s, and ten of the hottest years have
occurred during the last 15 years.
 The
following are events which consistent with scientists predictions of the effects
of global warming. The past two decades have witnessed a stream of new heat and
precipitation records. Glaciers are melting around the world. There has been a
50 percent reduction in glacier ice in the European Alps since 1900. Alaskas
Columbia Glacier has retreated more than 12 kilometres in the last 16 years
while temperatures there have increased. A huge section of an Antarctic ice
shelf broke off. Some scientists think this may be the beginning of the end for
the Larsen B ice shelf, which is about the size of Connecticut. Severe floods
like the devastating Midwestern floods of 1993 and 1997 are becoming more
common. Infectious diseases are moving into new areas. Corresponding with global
warming, sea levels have risen, and climatic zones are shifting. All these
changes exemplify the environmental impact of global climate change. Global
warming and climate change pose a serious threat to the survival of many species
and to the well-being of people around the world.
The
following are events which consistent with scientists predictions of the effects
of global warming. The past two decades have witnessed a stream of new heat and
precipitation records. Glaciers are melting around the world. There has been a
50 percent reduction in glacier ice in the European Alps since 1900. Alaskas
Columbia Glacier has retreated more than 12 kilometres in the last 16 years
while temperatures there have increased. A huge section of an Antarctic ice
shelf broke off. Some scientists think this may be the beginning of the end for
the Larsen B ice shelf, which is about the size of Connecticut. Severe floods
like the devastating Midwestern floods of 1993 and 1997 are becoming more
common. Infectious diseases are moving into new areas. Corresponding with global
warming, sea levels have risen, and climatic zones are shifting. All these
changes exemplify the environmental impact of global climate change. Global
warming and climate change pose a serious threat to the survival of many species
and to the well-being of people around the world.
FUTURE IMPACTS OF CLIMATE CHANGE
The IPCC estimates that air temperatures will increase by another 1-3,5 deg.
C, and sea levels may rise by up to 1 meter over the next 100 years. Changes of
this magnitude will affect many aspects of our lives. Here are some of them :
 |
 |
![]()
ACID RAIN
Another side effect of fossil fuels combustion and resulting emissions of
pollutants is acid rain (or acid deposition). In the process of burning fossil
fuels some of gases, in particular sulphur dioxide (SO2) and nitrogen oxides (NOx)
are created. Although natural sources of sulphur oxides and nitrogen oxides do
exist, more than 90% of the sulphur and 95% of the nitrogen emissions occurring
in North America and Europe are of human origin. Once released into the
atmosphere, they can be converted chemically into such secondary pollutants as
nitric acid and sulphuric acid, both of which dissolve easily in water. The
result is that any rain which follows is slightly acidic. The acidic water
droplets can be carried long distances by prevailing winds, returning to Earth
as acid rain, snow, or fog.
Natural factors such as volcanoes, swamps and decaying plant life all produce sulphur dioxide, one of the contributing gases to acid rain. These natural occurrences form some kind of acid rain. There are also some cases where acid rain may be produced naturally, which is also bad for the environment but occurs in much lower amounts and quantities than that of those found in urban areas. Between the 1950s and the 1970s the rain over Europe increased in acidity by approximately ten times. In the 1980s however, acidity levels decreased, but although many countries have started to do something about pollution that causes acid rain, the problem is not going away.
Acid rain is often phrased as acid precipitation. On the pH scale, rain usually measures 5.6. Anything below this measurement is said to be acidified rainfall. The chemical equation for acid rain is as follows:
SO2 (Sulphur dioxide) + NO (Nitrogen Oxide) + H2O (Water) = Acid rain
Water solutions vary in their degree of acidity. If pure water is defined as neutral, baking soda solutions are basic (alkaline) and household ammonia is very basic (very alkaline). On the other side of this scale there are ascending degrees of acidity; milk is slightly acidic, tomato juice is slightly more acidic, vinegar, lemon juice is still more acidic, and battery acid is extremely acidic. If there were no pollution at all, normal rainwater would fall on the acid side of this scale, not the alkaline side. Normal rainwater is less acidic than tomato juice, but more acidic than milk. What pollution does is cause the acidity of rain to increase. In some areas of the world, rain can be as acidic as vinegar or lemon juice.
This acid rain can cause damage to plant life, in some cases seriously affecting the growth of forests, and can erode buildings and corrode metal objects. The primary component involved in corrosion is acid rain. It is estimated that the damage to metal buildings alone amounts to about 2 billion dollars yearly. The highest emissions of sulphur come from those sectors, which use the most energy and the highest sulphur-content fuels, that is solid fuels and high sulphur heavy fuel oil. Solid fuels are the most polluting fossil fuels locally and globally. These fuels range from hard coals to soft brown coals and lignites, which have high proportion of combustion waste and pollutants such as sulphur, heavy metals, moisture and ash content.
One of the major problems with acid rain is that it gets carried from a mass acid rain producing area to areas that are usually not as badly affected. Tall chimneys that are built to ensure that the pollution that is produced by factories is taken away from nearby cities, puts the pollution into the atmosphere. When these particles get picked up by the moisture in the air, they form acids. As a result they become a part of the clouds. Then these clouds get carried off by wind, which means that when the rain falls it may be a long distance away from where the acidic particles were picked up from. An example of this would be Central and Eastern Europe and Scandinavia. Sweden suffer from acid rain because of huge sulphur emissions from Eastern European power plants with low emission standards and because of wind blowing the particles over to their country.
DAMAGE TO TREES AND SOIL
 |
When acid rain falls, it can effect forests as well as lakes and rivers. In many countries around the world, trees are suffering greatly because of the results of acid rain. A lot of trees are losing their leaves and thinning at the top. Some trees are affected so severely that they are dying. To grow, trees need healthy soil to develop in. Acid rain is absorbed into the soil making it virtually impossible for these trees to survive. As a result of this, trees are more susceptible to viruses, fungi and insect pests and they are not able to fight them and they then die. |
DESTRUCTION OF BUILDINGS
Acid rain can have a severe effect on buildings. Materials such as stone,
stained glass, paintings and other objects can be damaged or even destroyed. It
slowly, but gradually, eats away at the material until there is virtually
nothing left. Building materials crumble away, metals are corroded, the colour
in paint is spoiled, leather is weakened and crusts form on the surface of
glass. In certain parts of the world many famous and ancient buildings are been
damaged by acid rain. St. Pauls Cathedral in London is having its stone
work eaten away by acid rain. In Rome the Michelangelo statue of Marcus
Aurelius has been removed to protect it from air pollution.
 |
 |
ACID RAIN AND LAKES
Acid rain damages soil when it falls onto the ground. It also has a
noticeable effect when it falls directly into or is washed into lakes. Most of
the animal and plant life in clean lakes and rivers are unable to tolerate acid
rain. They can be poisoned by substances that the acid washes out from the
surrounding soil into the water. All over the world there are examples of plant
life and animal life suffering a lot or even not surviving the effects of acid
rain. For example, thousands of lakes in Scandinavia are without any kind of
life, whether it be animal or plant. Over the past years they have received a
lot of acid rain as a result of the wind blowing the particles into their
country form places such as England, Scotland and Eastern Europe. Since the 1930s
and 40s some Swedish lakes have increased acidic levels in their rain
water by up to 1,000 times.
 The
interactions between living organisms and the chemistry of their aquatic
habitats are extremely complex. If the number of one species or group of species
changes in response to acidification, then the ecosystem of the entire water
body is likely to be affected through the predator-prey relationships of the
food web. At first, the effects of acid deposition may be almost imperceptible,
but as acidity increases, more and more species of plants and animals decline or
disappear. As the water pH approaches 6.0, crustaceans, insects, and some
plankton species begin to disappear. As pH
approaches 5.0, major changes in the makeup of the plankton community occur,
less desirable species of mosses and plankton may begin to invade, and the
progressive loss of some fish populations is likely, with the more highly valued
species being generally the least tolerant of acidity. Below pH of 5.0,
the water is largely devoid of fish, the bottom is covered with undecayed
material, and the near shore areas may be dominated by mosses. Terrestrial
animals dependent on aquatic ecosystems are also affected. Waterfowl, for
example, depend on aquatic organisms for nourishment and nutrients. As these
food sources are reduced or eliminated, the quality of habitat declines and the
reproductive success of the birds is affected. Both natural vegetation and crops
can be affected.
The
interactions between living organisms and the chemistry of their aquatic
habitats are extremely complex. If the number of one species or group of species
changes in response to acidification, then the ecosystem of the entire water
body is likely to be affected through the predator-prey relationships of the
food web. At first, the effects of acid deposition may be almost imperceptible,
but as acidity increases, more and more species of plants and animals decline or
disappear. As the water pH approaches 6.0, crustaceans, insects, and some
plankton species begin to disappear. As pH
approaches 5.0, major changes in the makeup of the plankton community occur,
less desirable species of mosses and plankton may begin to invade, and the
progressive loss of some fish populations is likely, with the more highly valued
species being generally the least tolerant of acidity. Below pH of 5.0,
the water is largely devoid of fish, the bottom is covered with undecayed
material, and the near shore areas may be dominated by mosses. Terrestrial
animals dependent on aquatic ecosystems are also affected. Waterfowl, for
example, depend on aquatic organisms for nourishment and nutrients. As these
food sources are reduced or eliminated, the quality of habitat declines and the
reproductive success of the birds is affected. Both natural vegetation and crops
can be affected.
HUMAN HEALTH
 |
We eat food, drink water, and breathe air that has come in contact with acid deposition. Canadian and U.S. studies indicate that there is a link between this pollution and respirator problems in sensitive populations such as children and asthmatics. Acid rain also makes some toxic elements, such as aluminium, copper, and mercury more soluble. Acid deposition can increase the levels of these toxic metals in untreated drinking water supplies. High aluminium concentrations in soil can also prevent the uptake and use of nutrients by plants. |
BAD AIR QUALITY
 |
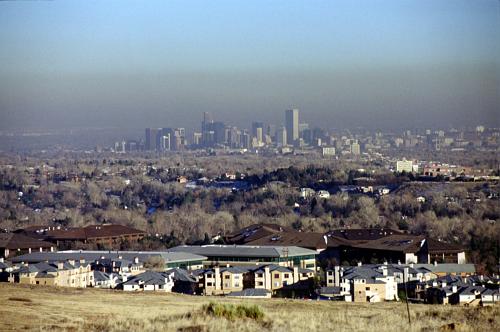
Beside greenhouse gases, SO2 and NOx emissions that cause acid rain, emissions of particulate matter contribute to bad air quality. Fuel combustion is the most important source of anthropogenic nitrogen oxides, while fuel combustion and evaporative emissions from motor vehicles are the main sources of anthropogenic volatile organic compounds (VOCs). Motor vehicles account for a considerable fraction of the total emissions of nitrogen oxides and VOCs in Europe and North America. NOx emissions also contribute to the formation of tropospheric photochemical oxidants. Photochemical oxidants, especially ozone (O3), are among the most important trace gases in the atmosphere. Their distributions show signs of change due to increasing emissions of ozone precursors (nitrogen oxides, or VOCs, methane and carbon monoxide). |
Smog over city.
Heavy metals like arsenic (As), cadmium (Cd), mercury (Hg), lead (Pb) and
zinc (Zn) are also released during fuel combustion. Lead pollution as the result
of road traffic emissions have decreased markedly since early 80s due to
increased consumption of unleaded gasoline and use of catalysts in cars.
Nevertheless this sector remains the main source of lead in atmosphere.
Beside emissions of pollutants there are also some other impacts of
fossil fuel combustion on local environment. Here microclimatic impacts like
origination of fogs, less sunshine etc. are the results of large amounts of
water vapour effluents from cooling towers of power plants.
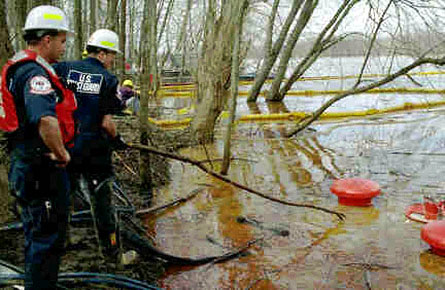
SEA POLLUTION
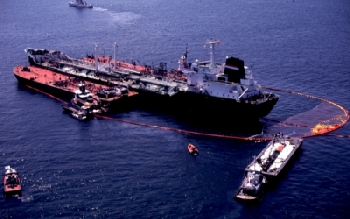 |
Damage caused by the transport of oil is related to the pollution of the seas. Here as the scale of oil production has increased during the twentieth century, the quantity of oil transported around the world, most of it by the sea, has also increased. To cope with this increase, in a highly competitive market, the size of oil tankers has increased to the point where they are by far the largest commercial ships. Even in routine operation, this results in large quantities of oil being released into the seas. The tankers fill up with water as ballast for return journeys. When this is emptied, significant quantities of oil are released as well. |
 |
Despite the fact that the transport of oil is generally a safe
industry, the scale of it, and the size of tankers, means that when accidents
do occur they have a large effect. Although the number of accidents is small
in proportion to the number of tanker journeys, thousands of minor incidents
involving oil spills from tankers, and oil storage facilities occur annually. Between 1970 and 1985 there were 186 major oil spills each involving more than 1300 tonnes of oil. In 1989, the tanker Exxon Valdez ran aground off Alaska, releasing 39.000 tonnes of oil to form a slick covering 3.000 square kilometres and causing widespread environmental damage. People usually tend to think of the seas as a vast reservoir which can soak up limitless quantities of whatever we put into it. In fact, the scale of pollution from oil is such that clumps of floating oil are now common almost anywhere in the worlds oceans. |
Oil trade movements
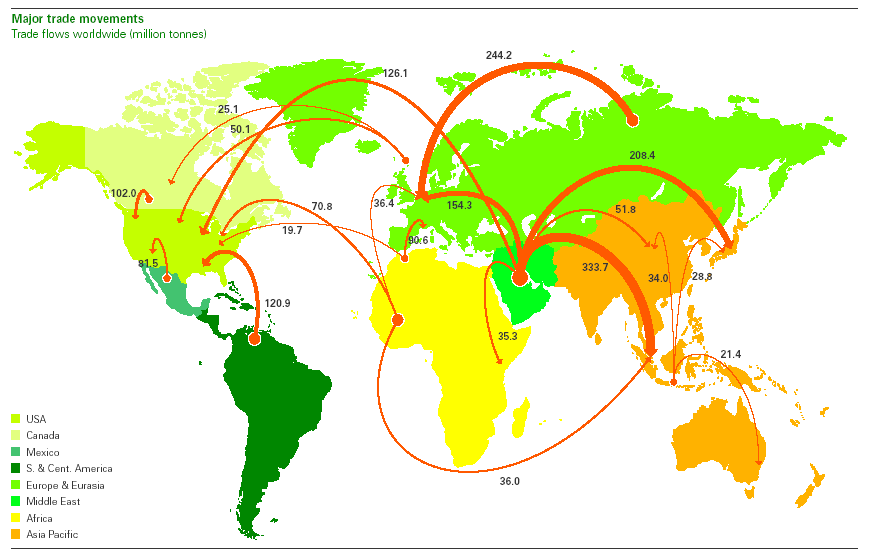
Source : BP statistics 2004
![]()
SOCIAL
PROBLEMS RELATED TO ENERGY USE
Beside environmental problems associated with large-scale use of fossil and
nuclear fuels and the problems with sustainability there are also social
problems arising from present trends of energy utilization.
Political and economic problems
 In
the earlier stages of the industrial revolution, fuel sources were local and
widely distributed. Industrial activity tended to grow in areas where local
sources of coal were available. As the transport associated with
industrialisation spread and developed, fuels began to be transported from more
and more distant places. Now, with the most accessible sources of oil and gas
depleted, fuels are transported around the world from small number of major
producing areas. The result is that the major industrial nations have become
dependent upon supplies from those producing nations, in particular oil from the
Middle East, and are highly vulnerable to disruption of these supplies. This
vulnerability and dependence has been a major factor shaping world politics. A
series of major economic and political crises has resulted from Sues crisis in
1956 to the 1970s, oil crisis to the Gulf war in early 1990s and even the war in
Iraq can be linked to the huge resources of oil in this country.Since the
producing nations are generally weak militarily and the consuming nations are
generally stronger, latter are under pressure to dominate the former
economically, politically and if necessary, militarily to maintain access to oil
(most important fuel today).
In
the earlier stages of the industrial revolution, fuel sources were local and
widely distributed. Industrial activity tended to grow in areas where local
sources of coal were available. As the transport associated with
industrialisation spread and developed, fuels began to be transported from more
and more distant places. Now, with the most accessible sources of oil and gas
depleted, fuels are transported around the world from small number of major
producing areas. The result is that the major industrial nations have become
dependent upon supplies from those producing nations, in particular oil from the
Middle East, and are highly vulnerable to disruption of these supplies. This
vulnerability and dependence has been a major factor shaping world politics. A
series of major economic and political crises has resulted from Sues crisis in
1956 to the 1970s, oil crisis to the Gulf war in early 1990s and even the war in
Iraq can be linked to the huge resources of oil in this country.Since the
producing nations are generally weak militarily and the consuming nations are
generally stronger, latter are under pressure to dominate the former
economically, politically and if necessary, militarily to maintain access to oil
(most important fuel today).
 |
 |
Oil price depends on political situation and each conflict in oil
sensitive region leads to higher energy prices. World economy is thus shaped
with such conflicts.
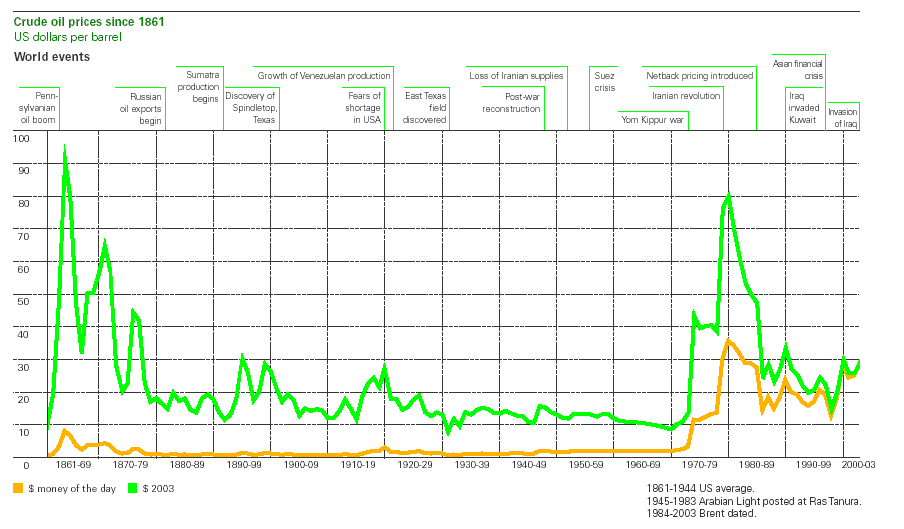
Source : BP statistics 2004
VULNERABILITY DUE TO CENTRALISATION
 A related
aspect of vulnerability in the present form of industrialisation is the
centralized nature of fuel production and distribution. Electricity is generated
in relatively few, very large power stations, and distributed through the
country. Oil is imported in giant tankers, and converted to fuel in large
refineries for further distribution. Concerns have been expressed that these
large, vital installations offer potential target for terrorists or military
opponents. As has been seen in recent years in the Middle East (Gulf War), the
result can be massive ecological damage as well as economic devastation. The
normal response to such vulnerability is to put greater resources into security
and to increased level of protection. High level of centralisation leads also to
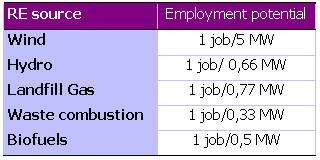
problems with employment. Decentralized energy production and utilization which
is the case of renewable energy sources can create much more new jobs than
centralized fossil fuel installations.
A related
aspect of vulnerability in the present form of industrialisation is the
centralized nature of fuel production and distribution. Electricity is generated
in relatively few, very large power stations, and distributed through the
country. Oil is imported in giant tankers, and converted to fuel in large
refineries for further distribution. Concerns have been expressed that these
large, vital installations offer potential target for terrorists or military
opponents. As has been seen in recent years in the Middle East (Gulf War), the
result can be massive ecological damage as well as economic devastation. The
normal response to such vulnerability is to put greater resources into security
and to increased level of protection. High level of centralisation leads also to
problems with employment. Decentralized energy production and utilization which
is the case of renewable energy sources can create much more new jobs than
centralized fossil fuel installations.
MILITARY DANGERS FROM NUCLEAR
PROLIFERATION
 Nuclear
weapon proliferation is one of the biggest threat to the world peace today with
several countries already in or trying to be a member of nuclear club. In
developed countries nuclear electricity industries grew out of nuclear weapons
development. The earliest nuclear reactors were built to produce material for
nuclear bombs. There has always been a close connection between the two terms of
the technology used, so that military spending on research and development for
nuclear weapons technology has in effect been a major subsidy for civilian
nuclear electricity industries. Nuclear fuel is not directly useful for nuclear
weapons. Much further processing is needed. However, for a country wishing to
develop nuclear weapons without publicly revealing the fact, an obvious approach
would seem to be combine weapons development with a nuclear electricity
generation industry.
Nuclear
weapon proliferation is one of the biggest threat to the world peace today with
several countries already in or trying to be a member of nuclear club. In
developed countries nuclear electricity industries grew out of nuclear weapons
development. The earliest nuclear reactors were built to produce material for
nuclear bombs. There has always been a close connection between the two terms of
the technology used, so that military spending on research and development for
nuclear weapons technology has in effect been a major subsidy for civilian
nuclear electricity industries. Nuclear fuel is not directly useful for nuclear
weapons. Much further processing is needed. However, for a country wishing to
develop nuclear weapons without publicly revealing the fact, an obvious approach
would seem to be combine weapons development with a nuclear electricity
generation industry.
RENEWABLE
ENERGY SOURCES
 Fortunately,
solutions exist to cut greenhouse gas emissions, reduce acid deposition, improve
air quality and to solve social problems related to recent energy use. Shifting
investment from fossil fuels like coal and oil to renewable energy and energy
efficiency would allow cleaner, more sustainable sources of energy to take their
rightful place as market leaders.
Fortunately,
solutions exist to cut greenhouse gas emissions, reduce acid deposition, improve
air quality and to solve social problems related to recent energy use. Shifting
investment from fossil fuels like coal and oil to renewable energy and energy
efficiency would allow cleaner, more sustainable sources of energy to take their
rightful place as market leaders.
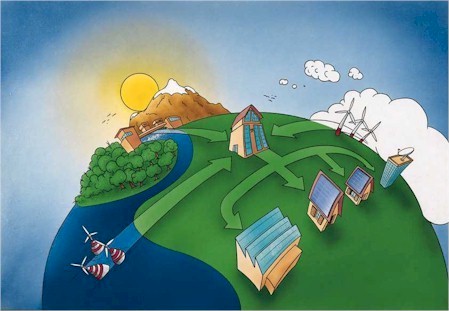
 Renewable
energy systems use resources that are constantly replaced and are usually less
polluting. All renewable energy sources solar energy, hydro power, biomass
and wind energy have their origin in activity of the Sun. Geothermal energy
which, because of its inexhaustible potential, is sometimes considered as
renewable source is getting energy from the heat of the earth.
Renewable
energy systems use resources that are constantly replaced and are usually less
polluting. All renewable energy sources solar energy, hydro power, biomass
and wind energy have their origin in activity of the Sun. Geothermal energy
which, because of its inexhaustible potential, is sometimes considered as
renewable source is getting energy from the heat of the earth.
Renewable energy is a domestic resource which has the potential to contribute to or provide complete security of energy supply. Countries that depend on imports of fossil fuel resources are in danger due to the risk of sharp rise of the cost of imported energy (mainly oil). This is particularly so for developing countries, where the oil import bill adds every year to the problem of financing an already large external deficit.
 |
|
FUTURE OF RENEWABLES
 The shape of our
future will be largely determined by how we generate and apply technological
innovation the most powerful force for progress in the modern world. The
renewable energy sources are able to have a strong transformative effect on the
whole of society in the coming decades. By virtually all accounts, renewable
energy resources will be an increasingly important part of the power generation
mix over the next several decades. Not only do these technologies help reduce
global carbon emissions, but they also add some much-needed flexibility to the
energy resource mix by decreasing our dependence on limited reserves of fossil
fuels. Experts agree that hydropower and biomass will continue to dominate the
renewables arena for some time. However, the rising stars of the renewables
world - wind power and photovoltaics - are on track to become strong players in
the energy market of the next century. Wind power is the fastest-growing
electricity technology currently available. Wind-generated electricity is
already competitive with fossil-fuel based electricity in some locations, and
installed wind power capacity now exceeds 10,000 MW world-wide. Meanwhile, PV
electricity - although currently three to four times the cost of conventional,
delivered electricity - is seeing impressive growth world-wide. PV is
particularly attractive for applications not served by the power grid. Advanced
thin-film technology (a much less expensive option than crystalline silicon
technology) is rapidly entering commercial-scale production.
The shape of our
future will be largely determined by how we generate and apply technological
innovation the most powerful force for progress in the modern world. The
renewable energy sources are able to have a strong transformative effect on the
whole of society in the coming decades. By virtually all accounts, renewable
energy resources will be an increasingly important part of the power generation
mix over the next several decades. Not only do these technologies help reduce
global carbon emissions, but they also add some much-needed flexibility to the
energy resource mix by decreasing our dependence on limited reserves of fossil
fuels. Experts agree that hydropower and biomass will continue to dominate the
renewables arena for some time. However, the rising stars of the renewables
world - wind power and photovoltaics - are on track to become strong players in
the energy market of the next century. Wind power is the fastest-growing
electricity technology currently available. Wind-generated electricity is
already competitive with fossil-fuel based electricity in some locations, and
installed wind power capacity now exceeds 10,000 MW world-wide. Meanwhile, PV
electricity - although currently three to four times the cost of conventional,
delivered electricity - is seeing impressive growth world-wide. PV is
particularly attractive for applications not served by the power grid. Advanced
thin-film technology (a much less expensive option than crystalline silicon
technology) is rapidly entering commercial-scale production.
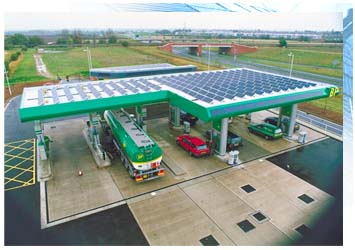 |
The BP gasoline station with photovoltaic panels on the roof. |
 |
Different scenarios show the contribution of renewables by 2010 to range from 9.9% to 12.5%, but a goal of 12% renewables share (an ambitious but realistic objective) was set, to be achieved through the installation of one million PV roofs, 15,000 MW of wind and 1,000 MW of biomass energy. The current 6% share includes large-scale hydro, which will not expand for environmental reasons. Growth is expected from biomass, followed by 40 GW of wind and 100 million square metres of solar thermal collectors. Photovoltaics will grow up 3 GWp, geothermal by 1 GWe and heat pumps by 2.5 GWth. Total capital investment to achieve the 12% target will be 165 billion ECU (1997-2010), but it would create up to 900,000 new jobs and drop CO2 emissions by 402 million tonnes/a. |
 |
Contributing less than 6% to the EUs energy consumption, it called
for a joint effort to increase this level for export potential and to address
climate change. More than half of Europes energy is imported, and
will rise to 70% by 2020 without action.
The European Wind Energy Association estimates up to 320,000 jobs would be created if 40 GW of wind power is installed, the PV Industry Association says it would create 100,000 jobs if 3 GWp is met, the Solar Industry Federation estimates 250,000 jobs under its market objective, and another 350,000 jobs could be created to meet the export market. The white paper proposes a number of tax incentives and other fiscal measures to encourage investments in renewable energies, and measures to encourage passive solar. The overall objective of doubling the current share of renewables to 12% by 2010 can be realistically achieved, it concludes, and the contribution of renewables to electricity generation could grow from 14% to more than 23% by 2010 if appropriate measures are instituted. |
 While
it is extremely difficult to quantify the external costs of such pollution, and
some simply cannot be quantified, several studies show them to be substantial.
For example, a German study concluded that the external costs (excluding global
warming) of electricity generated from fossil-fuel plants are in the range of
2.4-5.5 US c/kWh, while those from nuclear power plants are 6.1-3.1 c/kWh.
According to the another study sulphur dioxide from US coal burning plants is
costing U.S. citizens USD 82 billion per year in additional health costs.
Reduced crop yields caused by air pollution is costing US farmers USD 7.5
billion per year. What is important on these US figures is the fact that US
citizens are actually paying between 109 billion and 260 billion dollars yearly
in hidden energy costs. In other countries similar patterns can also be found.
Had external economic effects been included in the market allocation process,
renewable technologies would be in a far better position to compete with fossil
fuels, and there might already have been a substantial shift to the penetration
of renewable in the market.
While
it is extremely difficult to quantify the external costs of such pollution, and
some simply cannot be quantified, several studies show them to be substantial.
For example, a German study concluded that the external costs (excluding global
warming) of electricity generated from fossil-fuel plants are in the range of
2.4-5.5 US c/kWh, while those from nuclear power plants are 6.1-3.1 c/kWh.
According to the another study sulphur dioxide from US coal burning plants is
costing U.S. citizens USD 82 billion per year in additional health costs.
Reduced crop yields caused by air pollution is costing US farmers USD 7.5
billion per year. What is important on these US figures is the fact that US
citizens are actually paying between 109 billion and 260 billion dollars yearly
in hidden energy costs. In other countries similar patterns can also be found.
Had external economic effects been included in the market allocation process,
renewable technologies would be in a far better position to compete with fossil
fuels, and there might already have been a substantial shift to the penetration
of renewable in the market.
ENERGY SUBSIDIES
Many governments are heavily subsidising the energy industries. It is
interesting to note that the energy technologies with the worst health and
environmental impacts usually receive the most government money. The worst
polluters, nuclear and combustion technologies, in the U.S. alone receive 90% of
the government money. The renewable energy technologies, which offer little or
no side effects, receive the least government support. Solar technologies (both
PV and thermal together) receive in the USA only 3% of the government money. At
the bottom of the list is conservation with 2% of the subsidy dollars. And there
is not much difference in other countries of the world. This is amazing since
renewables and energy savings offer relief from our energy problems and has no
environmental side effects. Something is really wrong here.
MILITARY
 Worlds
dependence on imported oil requires that military will keep the international
supply lines open. The U.S. military is spending between 14.6 and 54 billion
dollars yearly just defending the oil supplies coming from the Persian Gulf. On
the low side, the National Defence Council places the Persian Gulf military cost
at 14.6 billion. On the high side, the estimate of 54 billion is made by the
Rocky Mountain Institute. There are also other hidden national security costs.
One of these is military aid to oil producing nations. Another is diplomatic and
foreign policy decisions made on the basis of imported oil.
Worlds
dependence on imported oil requires that military will keep the international
supply lines open. The U.S. military is spending between 14.6 and 54 billion
dollars yearly just defending the oil supplies coming from the Persian Gulf. On
the low side, the National Defence Council places the Persian Gulf military cost
at 14.6 billion. On the high side, the estimate of 54 billion is made by the
Rocky Mountain Institute. There are also other hidden national security costs.
One of these is military aid to oil producing nations. Another is diplomatic and
foreign policy decisions made on the basis of imported oil.
RADIOACTIVE WASTE
The major problem associated with nuclear power is, What do we do with the
radioactive waste? To date, no one has a viable disposal solution for the
thousands of tonnes of high level radioactive waste nuclear power plants
generate. This problem is made more severe because it is a long term problem.
For example, plutonium (Pu239) has a radioactive half-life of 24,400 years and
is environmentally dangerous for over several hundred thousands years. We are
making nuclear decisions now that will affect our planet, and all life forms on
it, for millennia in the future. The World Watch Institute estimates the
disposal costs of nuclear waste at between 1.44 and 8.61 billion dollars per
year. Radioactive waste disposal is not actually disposal, but containment. We
will have to deal with high level waste for thousands of years. We now have no
method of actually disposing of high level waste. We simply store it and hope
our children can figure out a safe way to deal with it. This estimate doesnt
include the cost of nuclear accidents. What does a Chernobyl or Three Mile
Island cost to clean up?

TOP
![]()