![]()

Vital
Climate Graphics : Introduction to climate change
Next: The cooling factors
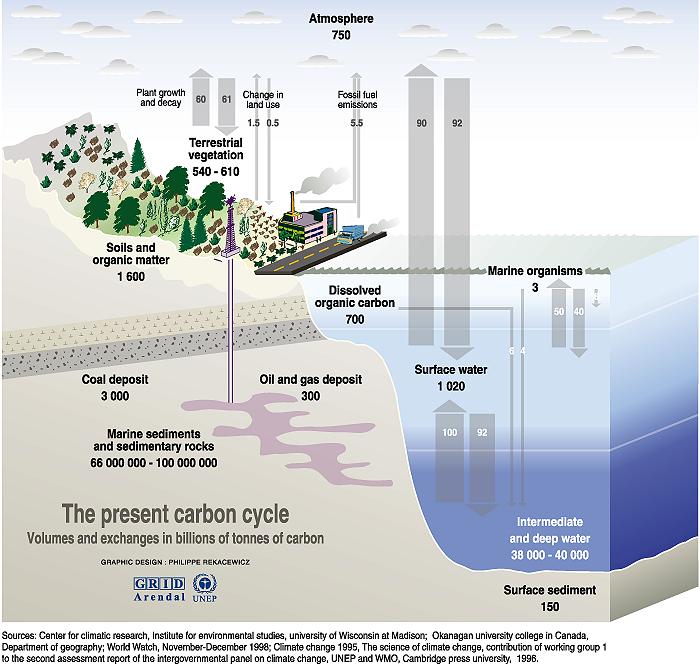
11. The global carbon cycle shows the carbon reservoirs in GtC (gigatonne= one thousand million tonnes) and fluxes in GtC/year. The indicated figures are annual averages over the period 1980 to 1989. The component cycles are simplified and the figures present average values. The riverine flux, particularly the anthropogenic portion, is currently very poorly quantified and is not shown here. Evidence is accumulating that many of the fluxes can fluctuate significantly from year to year. In contrast to the static view conveyed in figures like this one, the carbon system is dynamic and coupled to the climate system on seasonal, interannual and decadal timescales.
Vital Climate Graphics : Introduction to climate change
Text and graphics may be reproduced in whole or in part and in any form
for educational or non-profit purposes, provided that credit is given to the source.