![]()

Vital
Climate Graphics : Introduction to climate change
Next: CO2 emissions from industrial processes
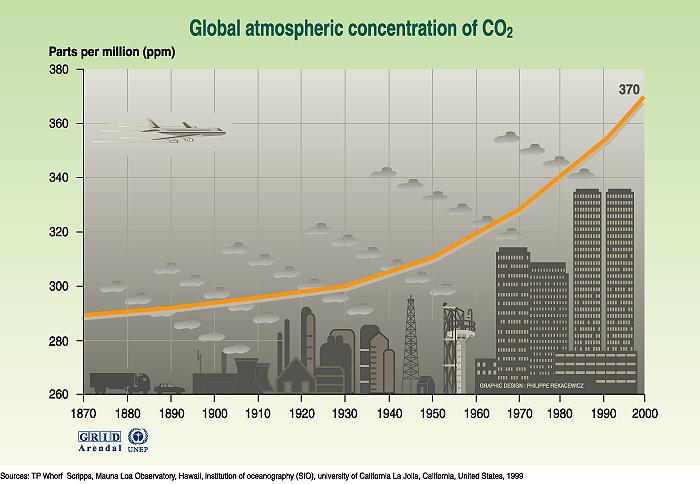
7. Atmospheric CO2 has increased from a pre-industrial concentration of about 280 ppmv to about 367 ppmv at present (ppmv= parts per million by volume). CO2 concentration data from before 1958 are from ice core measurements taken in Antarctica and from 1958 onwards are from the Mauna Loa measurement site. The smooth curve is based on a hundred year running mean. It is evident that the rapid increase in CO2 concentrations has been occurring since the onset of industrialization. The increase has closely followed the increase in CO2 emissions from fossil fuels.
Vital Climate Graphics : Introduction to climate change
Text and graphics may be reproduced in whole or in part and in any form
for educational or non-profit purposes, provided that credit is given to the source.